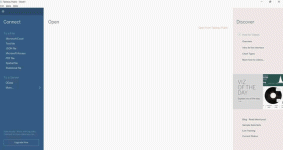
Now that you’ve downloaded Tableau Public, we can start it and load the data. In this tutorial we will use the our world in data dataset related to water withdrawals per person. To provide some context, water withdrawal refers to the amount of freshwater that is collected from surface water (for example, rivers and lakes) or groundwater (e.g., wells) and is then used for agriculture, industry, and domestic (public) use. As you can probably guess from the news cycle, there is quite a bit of variability in the available quantity of fresh water in the world, and we will visualize this difference between countries using Tableau.
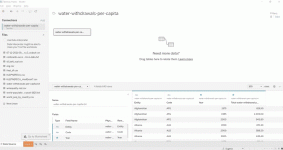
You will need to download the CSV file first, and depending on how you’ve configured your computer after that you’ll need to save the CSV as a text file, since Tableau Public can only load certain types of files. You can find what types of files you can load on the Start Page. Click on Text File in the left menu and then open your text file. You will be taken to the new page and the data preview with the fields from the dataset. We can see that we have four fields and 640 rows, with each row corresponding to a particular country and a particular year.

Many operations in Tableau mimic those we have used in Excel, such as renaming, changing the data type, or adding profiles. To start, let’s rename the first two fields to 'Country Name' and 'Country Code.' In this case, we do not need to change the field type, as Tableau knows where to put your data automatically. Finally, we will need latitude and longitude so that we can create an interactive geographical map. We can obtain that by changing the 'Country Name' geographic role from 'None' to 'Country/Region'. Next, we will click the Sheet 1 button, and we will see latitude and longitude added as fields.

You will need to download the CSV file first, and depending on how you’ve configured your computer after that you’ll need to save the CSV as a text file, since Tableau Public can only load certain types of files. You can find what types of files you can load on the Start Page. Click on Text File in the left menu and then open your text file. You will be taken to the new page and the data preview with the fields from the dataset. We can see that we have four fields and 640 rows, with each row corresponding to a particular country and a particular year.

Many operations in Tableau mimic those we have used in Excel, such as renaming, changing the data type, or adding profiles. To start, let’s rename the first two fields to 'Country Name' and 'Country Code.' In this case, we do not need to change the field type, as Tableau knows where to put your data automatically. Finally, we will need latitude and longitude so that we can create an interactive geographical map. We can obtain that by changing the 'Country Name' geographic role from 'None' to 'Country/Region'. Next, we will click the Sheet 1 button, and we will see latitude and longitude added as fields.
